When it comes to network testing, the most efficient methodology and tools is the formula for success. When under pressure, a technician may loose focus or skip important steps. In this document, I will help you build your toolbox and methodology. To keep this document as concise as possible, I took a high level approach to better explain every tool and layer along the way.

Build your toolbox for optimized network testing. This guide provides advice to ensure that every network function is properly tested and monitored. Read:
- Network testing basics
- 5 critical networking testing tools
- Proven troubleshooting techniques
- How to avoid common testing mis-steps
Table of Contents
Introduction
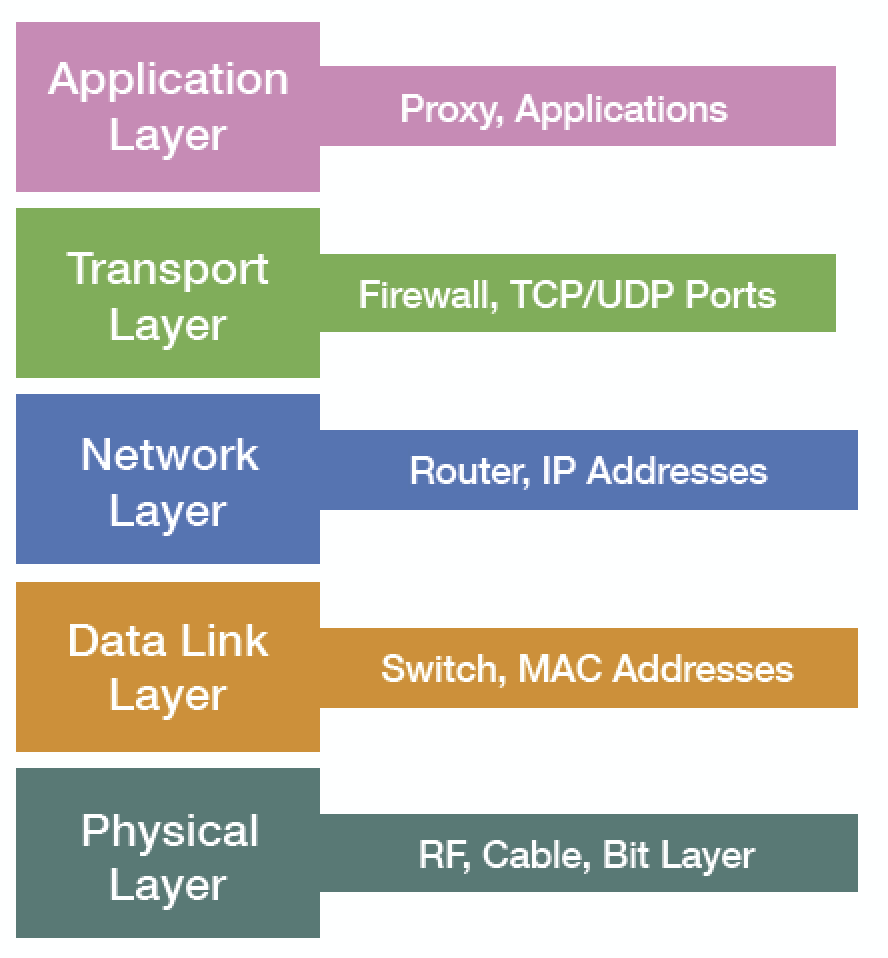
These five layers from the OSI Model are the best way to visualize what areas to cover. Each layer correlates to a network function, not necessarily a physical device. In most cases, multiple layers can cover a single physical device. For example, a router with NAT configured, will cover the Physical, Data Link, Network and Transport Layers. Regardless of which layers are covered by that device, you should still ensure that every layer is tested and monitored from the bottom up.
Layer 1: Cable Testers and Spectrum Analyzers
When I present, I sarcastically say, “If it can electrocute, blind, burn or hang you, it’s layer one”. In some cases, this is the most straightforward layer since most of this layer is something you can physically touch, feel or see. At this layer, I am referring to cable testers and spectrum analyzers. A time-domain reflectometer (TDR) is an electronic instrument use to characterize and locate faults in twisted pair wire. It can also be used to locate discontinuities along an electrical path. The equivalent device for an optical fiber is referred to as an optical timedomain reflectometer.
There is a difference between cable certification tools and testing tools so take the time to figure out what you have. Check your network equipment documentation since some switches can perform simple TDR tests.

A physical inspection is also recommended to ensure that the cable isn’t physically damaged. Below are various examples of problems I have come across in the field to look out for.

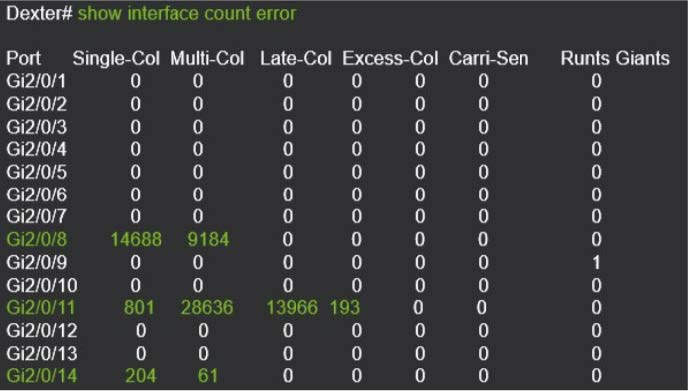
It also pays to use your network monitoring system or equipment CLI commands to help identify ports that may have physical layer issues. This technique is invaluable when troubleshooting issues at remote sites.
Lastly, don’t forget about interface speed and duplex mismatches. It is important to check your port settings are configured versus what the actual speed and duplex is. Switchminer is a great free open source tool to will query your switch and display your speed, duplex, and errors.
Layer 2: MAC Addresses
This layer involves devices and tools that recognize a MAC address. A big part of this is identifying what port devices reside on. SwitchMiner and similar applications can produce a table or report of MAC addresses and their corresponding port location.

Wireshark or your favorite protocol analyzer is a great way to identify MAC addresses and any layer 2 related issues.
Things to look for range from security like ARP flooding, spoofing and man in the middle attacks on performance related issues like load balancing, flooding and Spanning Tree.
Layer 3: Ping and Traceroute
This is the most well-referenced layer since it covers tools like ping and traceroute. This layer can get quite involved so let’s start with the basics.
Good old ping is used to test reachability as well as response time. It is important to note that ping uses ICMP and will typically default to a small payload and allows IP fragmentation. When troubleshooting layer 3 problems, you should modify the default payload size to match your application packet size. Consider also disabling the IP layer fragmentation by setting the DF bit to true. This way, your test traffic is treated more like a TCP packet since most client operating systems do not allow IP fragmentation for TCP.
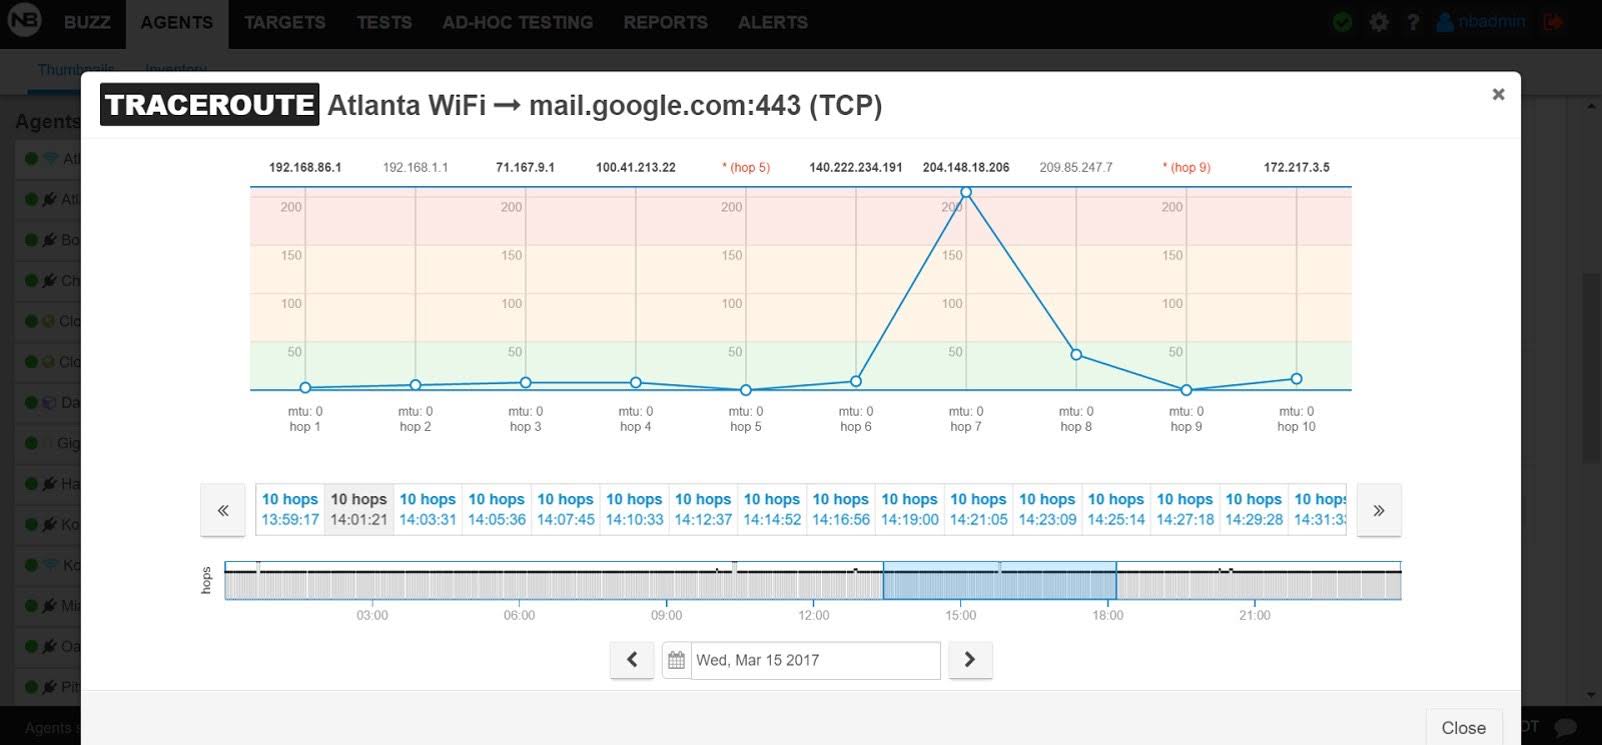
Traceroute is a similar utility that reports back the IP address and name of all layer 3 devices along the path to the destination device by increasing the IP time to live (TTL). The fragmentation tip mentioned earlier also applies to traceroute. You should have a TCP or UDP ping or traceroute tool, like NetBeez, which provides a browser-based interface for both of these tests.
This is where things can get confusing since you are referencing a layer 4 port number but testing a layer 3 route. It can be very helpful to have a layer 3 tool that tests reachability and routing, where possible, and that allows you to modify the payload size and fragmentation. An added bonus would be a scheduling and reporting feature as well as alerts (syslog, email or log) when thresholds are exceeded.
Layer 4: TCP and UDP
This layer involves TCP or UDP port numbers which imply that you need to know what port numbers your application uses. In some cases, it will be obvious. For example, a web-based application will use TCP port 80 or 443 by default. If using Chrome and QUIC it could be UDP port number 443 when communicating to various Google sites. Try out the windows netstat –b command from an elevated command prompt. Currports is a free, portable, Windows GUI based application that will provide the same information as netstat –b with extra features.

At Layer 4 you need tools or methodologies that measure the time between the TCP SYN and SYN ACK. This is also referred to as the ‘TCP connect time’. The screenshot below is from Wireshark and illustrates a TCP connect time of 14 ms.

As mentioned with traceroute and ping, having a scheduling option would be very helpful. NetBeez provides reporting and scheduling for their HTTP checks. The screenshot below is from NetBeez’s dashboard.

Layer 7: Performance Measurement
This is the application layer where we focus on measuring performance and other application related issues. The most straightforward way of doing this is to capture the packets of a real client running a real application on your real network. The reason why I emphasize the word ‘real’ is because one option at this layer is to use products that simulate or model your applications. While there isn’t anything wrong with this I prefer real data. After you capture your packets, analyze the command and response delta times. One technique to make is easier is to filter on the IP and TCP port number (or conversation) combination.
In the screenshot below you can see the response took 68 ms to reply (65 + 3).

You can include performance at this layer (as well as layer 1).
If you use Microsoft Message Analyzer, you can also see which service is associated to a packet.

This is where many of the Application Performance Measurement tools come into play, as well as some of the protocol analyzers that provide advanced reporting. One example of automation tools that can measure response time is Apptimer. Another powerful web analysis method is using the Developer Tools in Internet Explorer or Chrome, as show here below.
