Predictive modeling relies on the relationship between predictions and ground truth. Learn how Predicted vs True charts assess model performance for classification and regression.
Table of Contents
Question
You have the Predicted vs. True chart shown in the following exhibit.
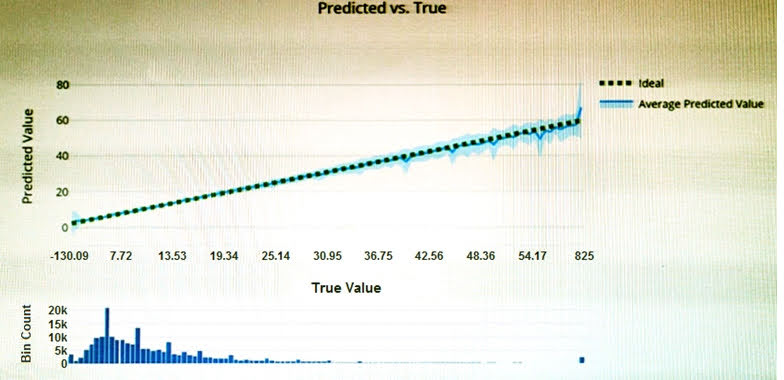
You have the Predicted vs. True chart shown in the following exhibit.
Which type of model is the chart used to evaluate?
A. classification
B. regression
C. clustering
Answer
B. regression
Explanation
What is a Predicted vs. True chart?
Predicted vs. True shows the relationship between a predicted value and its correlating true value for a regression problem. This graph can be used to measure performance of a model as the closer to the y=x line the predicted values are, the better the accuracy of a predictive model.
Microsoft Azure AI Fundamentals AI-900 certification exam practice question and answer (Q&A) dump with detail explanation and reference available free, helpful to pass the Microsoft Azure AI Fundamentals AI-900 exam and earn Microsoft Azure AI Fundamentals AI-900 certification.