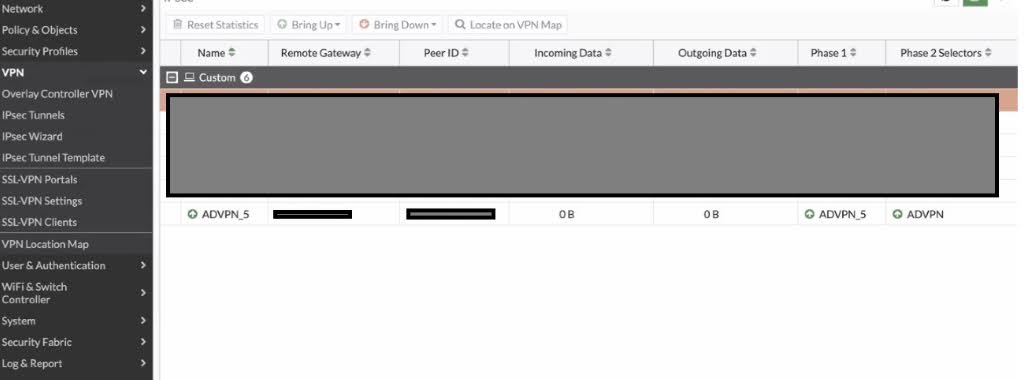
This article describes why zero bytes show for incoming and outgoing traffic once both phases of the IPsec tunnel are UP.
Scope
FortiOS 7.x.x.
Solution
There are some possible causes:
- Phase-2 Configuration is incorrect: Phase-2 selectors are mentioned in the configuration those are not the actual subnet, generating packet/data.
- Firewall Policy: It is possible that dedicated local and remote subnets are not added in the Firewall policy, however, check other matching criteria as well such as Incoming and outgoing interface, services, schedule and action ‘DENY’ or ‘ALLOW’.
- Routing: Ensure that for VPN traffic, FortiGate must proper routes for remote subnets and also check the routing table both Local firewall and remote firewall side and routes must be active.
- Device availability: There is no device connected to local FortiGate, generating traffic to remote side.
To resolve these kinds of issues.
Check the routing table using below command on both sides.
get router info routing-table details <destination (remote site)>
Ensure that output shows VPN interface.
Run continuous ping from local site to another site.
This can be done by device connected to the FortiGate LAN interface.
ping <remote IP>
if there is no device available, ping test can also be executed from the FortiGate CLI. In that case, specify the source IP.
exe ping-options source <FortiGate internal interface IP(also be part of Phase2 selector of phase-2)>
exe ping-options repeat count 99
exe ping <remote IP>
Run packet sniffer and debug flow command both sides.
CLI 1:
diagnose sniffer packet any “host <destination-IP> and icmp” 4 0 l
CLI 2:
diagnose debug reset
diagnose debug flow filter <destination-IP> <Source-IP> and
diagnose debug flow show function-name enable
diagnose debug flow show iprope enable
diagnose debug console timestamp enable
diagnose debug flow trace start 999
diagnose debug enable
To stop the debug:
diag debug dis
Check the flow filter and look for ‘offloading’ or ‘drop’.
If the results are showing on the one side, check for the ESP packets. Run the following sniffer on both sides.
diag sniffer packet any “host <remote-gateway-IP> and esp” 4 0 l
If there are no ESP packets and only port 500 traffic, it is possible that ESP packets are being dropped in transit.
In order to test, force the NAT-T on the phase1 configuration of the FortiGate.
After, look for port 4500 traffic using the following packet sniffer’s command.
diag sniffer packet any “host <remote-gateway-IP> and port 4500 ” 4 0 l
If traffic is still not showing in the IPsec monitor, raise a ticket with TAC with all of the above information.